Profiling with TensorFlow
This post concisely reviews the profiling concept and how to profile a deep learning model with TensorFlow.
Why Profiling?
Profiling a computer program aims to know more about its behaviour. By understanding the behaviour of a program, the developers can carry out optimizations resulting in higher performance. In addition, by profiling a program, the developer will detect the program’s bottlenecks. For example, suppose for a model, after profiling it, we figure out that 90% of its execution time is spent waiting for the preprocessed input data. In that case, it shows that data preprocessing is the bottleneck. If we can optimize that step, we will get tremendous speedups. For another scenario, consider that most of the execution time is spent on calculations like floating point operations. In this case, optimization techniques like mixed precision can result in dramatic speedup as they do fewer calculations while maintaining the acceptable computing quality.
Prerequisites
For profiling with TensorFlow, the following packages are required:
pip install tensorboard
pip install -U tensorboard_plugin_profile
For viewing TensorBoard remotely on your local browser, check the following post.
How to profile with TensorFlow?
For profiling with TensorFlow, we need to create and add a callback to the fir function of our model. Consider the following example.
import tensorflow as tf
import tensorflow_datasets as tfds
import keras
import numpy as np
import datetime
from datetime import datetime
from packaging import version
import os
print(“TensorFlow version: “, tf.__version__)
device_name = tf.test.gpu_device_name()
if not device_name:
   raise SystemError(‘GPU device not found’)
   print(‘Found GPU at: {}’.format(device_name))tfds.disable_progress_bar()
(ds_train, ds_test), ds_info = tfds.load(‘mnist’, split=[‘train’, ‘test’], shuffle_files=True, as_supervised=True, with_info=True)
def normalize_img(image, label):
“””Normalizes images: `uint8` -> `float32`.”””
    return tf.cast(image, tf.float32) / 255., labelds_train = ds_train.map(normalize_img)
ds_train = ds_train.batch(128)
ds_test = ds_test.map(normalize_img)
ds_test = ds_test.batch(128)
model = tf.keras.models.Sequential([
tf.keras.layers.Flatten(input_shape=(28, 28, 1)),
#tf.keras.layers.Dense(128,activation=’relu’),
tf.keras.layers.Dense(10, activation=’softmax’)
])
model.compile(
loss=’sparse_categorical_crossentropy’,
optimizer=tf.keras.optimizers.Adam(0.001),
metrics=[‘accuracy’]
)
# Create a TensorBoard callback
logs = “logs/” + datetime.now().strftime(“%Y%m%d-%H%M%S”)tboard_callback = tf.keras.callbacks.TensorBoard(log_dir = logs, histogram_freq = 1, profile_batch = ‘500,520’)model.fit(ds_train, epochs=10, validation_data=ds_test, callbacks = [tboard_callback])
What can we get from profiling with TensorFlow?
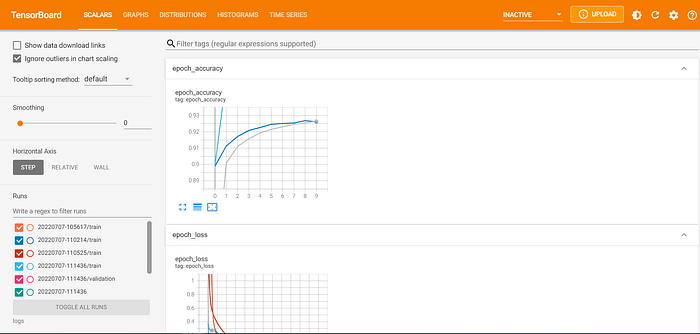
By opening TensorBoard on the browser, the following window will show up.

The following sub-menus are for analyzing model metrics, which are usually used for analyzing models’ performance:
- Scalars and metrics (developer can add customized metrics to be monitored over time, for example, learning rate. Check here to see how to log a custom scalar or metric)
- Images/ Text Data (for viewing input image/ text data, first, you need to write in log files. Check here for images and here for text if you want to show images, even create your confusion matrix, or view text data)
- Hyperparameter Tuning with the HParams Dashboard (they should be logged; otherwise, you would not see any information in its dashboard). Check here.
- Embedding Visualizer for showing high-dimensional embeddings (check here)
- Computation Graph (this graph shows how operations are accomplished to carry out the required computation by the model in TensorFlow.)

Read more about the tools that Tensorboard provides here.
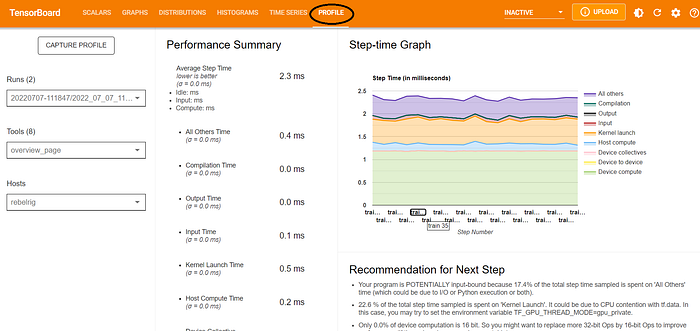
However, for profiling, we will need the profiling dashboard:

On the overviews page, TensorFlow gives recommendations for performance improvements. Besides, the Top 10 TensorFlow operations on GPU are shown:

There are tools for profiling on the left side of the profiling page.
- The input pipeline analyzer gives analyses and recommendations to the input pipeline of the model.
- Kernel stats: lists GPU kernels with their hardware needs, like the number of registers, shared memory bytes, etc.
- The memory profile tab shows a timeline graph for memory usage, giving info about
- TensorFlow stats: contains pie charts showing the amount of time spent on different sections. In addition, TensorFlow operations with the number of occurrences, total time, etc., are offered in a table.
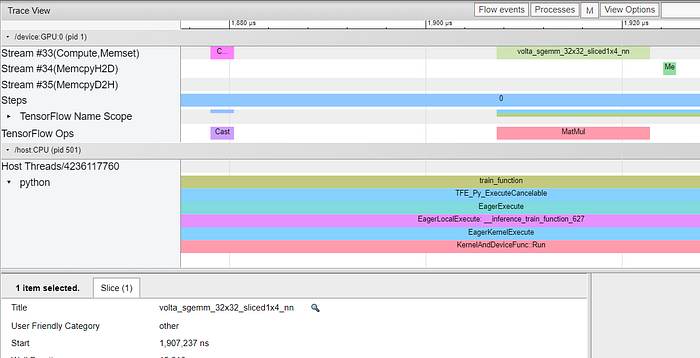
- Trace viewer: shows the timeline execution of the kernels and operations. It reveals a lot of information about how TensorFlow executes neural networks.
An example of the trace viewer tool:

More zoomed:

Conclusion
In this post, we reviewed profiling within TensorFlow with the help of Tensorboard. Profiling is accomplished to find the optimization potential of the goal program to gain speedups.
